Capitalization rates remain one of the most fundamental metrics in commercial real estate investment analysis, yet many investors struggle to interpret cap rate compression and its implications for portfolio strategy. As institutional capital continues flowing into U.S. commercial real estate markets in 2026, understanding the mechanics and market forces behind cap rate compression has become essential for accredited investors seeking to optimize acquisition timing and preserve returns.
Cap rate compression occurs when property values increase faster than net operating income, resulting in lower capitalization rates across a market or asset class. This phenomenon typically signals strong investor demand, favorable financing conditions, and positive economic sentiment. However, compressed cap rates also mean investors are accepting lower initial yields, which creates both opportunities and risks depending on market positioning and investment horizon. In Southern California’s competitive multifamily and commercial markets, cap rate compression has reached levels not seen since the pre-2008 cycle, prompting sophisticated investors to recalibrate their underwriting assumptions and portfolio strategies.
This analysis examines the current cap rate environment, historical compression cycles, and the strategic implications for real estate investors operating in a period of tightening yields and evolving capital market dynamics.
What Is a Cap Rate and Why Does It Matter?
The capitalization rate, or cap rate, represents the ratio between a property’s net operating income and its purchase price or current market value. Expressed as a percentage, the cap rate provides investors with a standardized metric for comparing investment opportunities across different markets, asset classes, and property types without needing to account for financing structure.
The formula is straightforward: Cap Rate = Net Operating Income / Property Value. A property generating $500,000 in annual NOI with a market value of $10 million produces a 5.0% cap rate. This metric serves as the foundation for valuation, return projections, and comparative analysis across the commercial real estate universe.
Cap rates function inversely to property values. As cap rates decline, property values increase, assuming NOI remains constant. This inverse relationship explains why investors closely monitor cap rate trends as indicators of market sentiment, pricing pressure, and potential value appreciation. Lower cap rates signal strong demand and higher prices, while higher cap rates indicate either distressed conditions or value opportunities depending on market context.
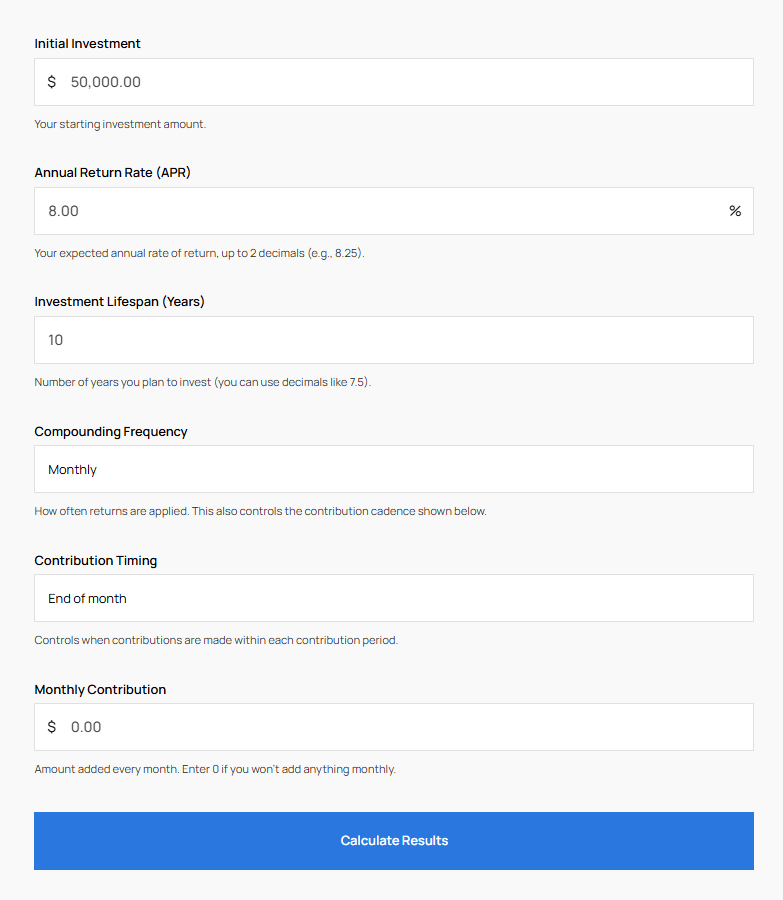
Unlike cash-on-cash return or internal rate of return, cap rates isolate property-level performance from financing effects. This allows investors to evaluate asset quality and market pricing independently of leverage decisions. However, cap rates only capture initial yield and do not account for income growth, capital expenditures, or exit assumptions that significantly impact total return. Sophisticated investors use cap rates as one component within a broader analytical framework that includes debt service coverage ratios, cash flow projections, and risk-adjusted return metrics available through tools like Primior’s investment calculator.
The cap rate also serves as a pricing benchmark during acquisition negotiations. Sellers and buyers reference prevailing cap rates in comparable transactions to establish valuation parameters. In compressed markets, buyers accepting lower cap rates must underwrite aggressive income growth or hold for longer appreciation to achieve target returns.
Understanding Cap Rate Compression
Cap rate compression refers to the decline in capitalization rates across a market, submarket, or asset class over a defined period. This compression occurs when property prices increase faster than net operating income, reducing the yield investors earn on their capital. A market where average multifamily cap rates decline from 5.5% to 4.5% over two years has experienced 100 basis points of compression.
Multiple factors drive compression, but the primary catalyst is increased buyer demand relative to available inventory. As more capital competes for limited assets, investors bid prices higher and accept lower initial yields. This demand imbalance stems from several sources: institutional capital allocation strategies, favorable debt markets, positive economic growth expectations, and portfolio rebalancing from lower-yielding asset classes like bonds.
Compression also reflects investor confidence in future income growth and property appreciation. Buyers paying premium prices at compressed cap rates are underwriting rent increases, occupancy improvements, or operational efficiencies that will expand NOI over time. This forward-looking analysis justifies accepting lower day-one yields in exchange for anticipated total return through income growth and value appreciation.
The inverse relationship between cap rates and interest rates creates another compression dynamic. As borrowing costs decline, leveraged returns improve even at lower cap rates, enabling investors to pay higher prices while maintaining acceptable equity returns. This debt capital availability amplifies pricing pressure and accelerates compression in markets with strong fundamentals.
However, compression carries inherent risks. Investors purchasing at historically low cap rates face limited margin for error if income growth underperforms, exit cap rates expand, or interest rates rise unexpectedly. The spread between cap rates and debt costs, known as leverage arbitrage, can compress or invert in rising rate environments, eliminating the return enhancement that justified premium pricing. Accredited investors evaluating opportunities in compressed markets must carefully assess whether projected income growth and exit assumptions justify current pricing, a discipline evident in Primior’s track record of selective acquisitions.
Historical Cap Rate Cycles and Market Context
Commercial real estate cap rates follow cyclical patterns correlated with economic growth, interest rate policy, and capital market conditions. Examining historical cycles provides context for interpreting current market dynamics and anticipating potential inflection points.
The 2008 financial crisis triggered the most dramatic cap rate expansion in modern real estate history. Multifamily cap rates in major markets widened from the mid-4% range to 7-8% as credit markets froze, transaction volume collapsed, and economic uncertainty peaked. This expansion represented a complete repricing of risk across the asset class as investors demanded higher yields to compensate for strengthend uncertainty.
The subsequent recovery from 2010 through 2019 produced sustained cap rate compression as economic expansion, low interest rates, and institutional capital inflows drove unprecedented pricing growth. Multifamily cap rates in core markets compressed below 4% by 2019, reaching pre-crisis levels despite fundamentally different market conditions. This compression phase rewarded investors who acquired assets during the expansion window and underwrote conservative exit cap rates.
The COVID-19 pandemic created a brief disruption in 2020, with cap rates temporarily widening as transaction activity paused and economic visibility declined. However, markets recovered faster than most analysts anticipated, and cap rates resumed compressing through 2021 and early 2022 as monetary stimulus, supply chain constraints, and inflation expectations drove real asset demand.
The Federal Reserve’s aggressive rate hiking cycle beginning in mid-2022 forced the first meaningful cap rate expansion since the financial crisis. As debt costs surged and equity return requirements increased, buyers demanded higher cap rates to maintain acceptable risk-adjusted returns. This adjustment period extended through 2023 and early 2024, with many markets experiencing 50-100 basis points of expansion.
In Southern California specifically, the compression and expansion cycles have been more pronounced due to supply constraints, demographic growth, and the concentration of institutional capital. Orange County and coastal Los Angeles submarkets compressed to sub-4% cap rates for Class A multifamily properties during peak periods, reflecting the scarcity value of well-located assets in supply-constrained markets. Understanding these cycles helps investors contextualize current market conditions relative to historical precedent documented in Primior’s commercial real estate report.
The 2026 Interest Rate Environment
The interest rate environment entering 2026 reflects a stabilization period following the Federal Reserve’s most aggressive tightening cycle in four decades. After raising the federal funds rate from near zero to over 5% during 2022-2023, the Fed has maintained a cautious stance as inflation moderates toward target levels and economic growth remains resilient.
Current conditions show the 10-year Treasury yield trading in the 4.0-4.5% range, down from the 5%+ peaks experienced in late 2023 but significantly strengthend compared to the sub-2% rates that prevailed during the pandemic period. This normalization has profound implications for commercial real estate pricing, as the relationship between Treasury yields and cap rates establishes baseline return expectations for real assets.
Commercial real estate debt markets have adjusted to this higher rate regime, with multifamily agency debt pricing in the mid-5% to low-6% range for standard leverage profiles. The spread between all-in debt costs and cap rates, critical for positive leverage, has compressed considerably compared to the 2010-2021 period. Investors who could previously achieve 200+ basis point spreads between cap rates and debt costs now operate with spreads of 50-100 basis points, reducing the return enhancement from leverage.
This narrower spread between cap rates and debt costs has created a more disciplined pricing environment where equity returns depend primarily on asset-level performance rather than financial engineering. Investors must underwrite realistic income growth and exit assumptions rather than relying on favorable financing to generate acceptable returns. This dynamic favors operators with proven asset management capabilities and market knowledge.
The forward path for interest rates remains uncertain, with scenarios ranging from additional Fed cuts if economic growth weakens to extended higher rates if inflation proves persistent. This uncertainty creates both risk and opportunity. Investors who acquire assets at current cap rates face interest rate risk if rates rise further, but they also position for potential value appreciation if rates decline and cap rates compress. The ability to hold through rate volatility and execute value-creation strategies becomes the primary determinant of return outcomes.
Fixed-rate agency debt remains attractive in this environment, providing investors with rate certainty and protection against potential short-term rate increases. This financing structure allows investors to underwrite returns based on property fundamentals rather than interest rate speculation, a principle emphasized in evaluating current syndication offerings where financing strategy directly impacts risk-adjusted returns.
Capital Flows and Institutional Investment
Institutional capital allocation patterns significantly influence cap rate trends across commercial real estate markets. Understanding these capital flows provides insight into pricing dynamics, market competition, and future trajectory.
Institutional investors, including pension funds, insurance companies, sovereign wealth funds, and private equity real estate firms, manage trillions of dollars allocated to commercial real estate. These investors operate with long investment horizons, professional management infrastructure, and portfolio diversification objectives that shape their acquisition strategies and return requirements.
The 2020-2024 period saw record institutional capital deployment into U.S. commercial real estate despite economic uncertainty. Multiple factors drove this activity: historically low interest rates making bonds unattractive, inflation hedging characteristics of real assets, and the perception that commercial real estate offers superior risk-adjusted returns compared to publicly traded alternatives. This capital surge intensified competition for assets and compressed cap rates across most markets and property types.
Multifamily real estate has attracted disproportionate institutional attention due to favorable demographic trends, housing supply constraints, and the essential nature of residential shelter. Southern California multifamily markets have been particularly competitive, with multiple bidders pursuing limited inventory and pushing pricing to levels that challenge traditional return thresholds.
Private credit and debt funds have also expanded significantly, providing alternative capital sources beyond traditional agency debt and bank financing. This capital availability has supported higher asset pricing by enabling buyers to secure financing even in tighter lending environments. However, this debt capital typically carries higher costs than agency debt, requiring buyers to accept lower leveraged returns or reduce leverage to maintain target equity returns.
Foreign capital, particularly from Canada, Europe, and Asia, continues targeting U.S. commercial real estate as a safe-haven investment with stable returns and currency diversification benefits. This international demand adds additional pricing pressure in gateway markets and desirable submarkets.
The deployment pace has moderated in 2026 as institutional investors reassess allocations in response to higher interest rates, economic uncertainty, and the need to rebalance portfolios after rapid appreciation. However, dry powder remains substantial, and institutional investors actively seek opportunities where pricing has corrected or where operational value creation can generate acceptable returns despite compressed cap rates.
Southern California Market Dynamics
Southern California commercial real estate markets exhibit unique characteristics that intensify cap rate compression relative to national averages. Supply constraints, demographic strength, and economic diversity create persistent demand-supply imbalances that support premium pricing.
The inability to increase housing supply at rates that match demand growth remains the fundamental driver of Southern California multifamily performance. Regulatory barriers, development costs, community opposition, and geographic constraints limit new construction, creating scarcity value for existing well-located assets. This supply-demand imbalance supports rent growth and occupancy levels that justify lower cap rates compared to markets with elastic supply responses.
Orange County exemplifies these dynamics, with average multifamily cap rates trading 50-75 basis points below national averages for comparable asset quality. Coastal submarkets command even lower cap rates due to location desirability, employment concentrations, and the permanence of supply constraints. Investors accept these compressed yields based on expectations for continued rent growth driven by job creation, household formation, and limited competitive supply.
The Inland Empire presents a contrasting profile, with industrial and logistics assets experiencing significant cap rate compression driven by e-commerce growth and reshoring trends. This submarket has attracted substantial institutional capital as investors recognize the strategic importance of supply chain infrastructure proximate to the Los Angeles/Long Beach port complex and regional consumption centers.
Los Angeles County multifamily markets segment into distinct submarket tiers based on location quality, tenant profiles, and supply dynamics. Westside submarkets trade at cap rates comparable to Orange County, while more affordable inland areas offer higher cap rates with exposure to different tenant demographics and income growth trajectories.
The depth of institutional capital targeting Southern California creates intense competition that compresses cap rates and reduces investment opportunities for all but the most patient and well-capitalized investors. Success in this environment requires deep local market knowledge, relationships with property owners before assets reach the open market, and the ability to identify value-creation opportunities that justify premium pricing.
Cap rate compression in Southern California reflects rational pricing based on long-term fundamentals rather than speculative excess. However, investors must recognize that compressed cap rates leave limited margin for error if economic conditions deteriorate, migration patterns reverse, or housing policy changes expand supply. The relationship between cash flow vs appreciation becomes particularly relevant in compressed markets where investors depend on NOI growth to achieve return objectives.
Strategic Implications for Acquisition and Portfolio Management
Cap rate compression fundamentally alters acquisition strategy and portfolio management decisions. Investors operating in compressed environments must adapt their approach to underwriting, target selection, and value creation to generate acceptable risk-adjusted returns.
Disciplined underwriting becomes paramount in compressed markets. Conservative income growth assumptions, realistic expense projections, and appropriate exit cap rate estimates prevent overpaying for assets based on optimistic scenarios. Investors should stress-test acquisitions against higher exit cap rates, slower NOI growth, and extended hold periods to ensure returns remain acceptable under adverse conditions.
Value-add and opportunistic strategies gain relative attractiveness in compressed core markets. Properties requiring physical improvements, repositioning, or operational enhancements offer higher return potential by creating NOI growth through active management rather than relying solely on market rent increases. This approach requires operational expertise and capital reserves but allows investors to underwrite return enhancement independent of market appreciation.
Geographic diversification across markets with different cap rate profiles provides portfolio risk management benefits. Balancing exposure between compressed gateway markets and higher-cap-rate secondary markets allows investors to access current income while maintaining positions in supply-constrained markets with long-term appreciation potential. This strategy requires understanding local market dynamics and the fundamental factors supporting cap rate differentials.
Refinancing and disposition timing become critical portfolio management decisions in compressed environments. Properties acquired at higher cap rates during previous cycles may offer significant value appreciation opportunities as cap rates compress. Strategic refinancing can crystallize this appreciation by extracting equity while maintaining ownership, while selective dispositions at compressed cap rates enable capital recycling into higher-yielding opportunities.
The hold period assumption requires recalibration in compressed markets. Investors purchasing at low cap rates must extend their anticipated hold periods to allow sufficient income growth to justify entry pricing or must underwrite exit cap rate expansion that reduces terminal value. This reality shifts investment strategy toward longer-duration holds with emphasis on cash flow generation rather than short-term appreciation exits.
Partnership and joint venture structures offer alternatives for accessing deals in compressed markets where standalone equity returns fall short of target thresholds. By partnering with operators who provide local expertise, capital relationships, or value-creation capabilities, passive investors can access opportunities that would otherwise remain economically unfeasible.
Debt strategy becomes increasingly important as cap rate compression reduces leverage arbitrage. Fixed-rate agency debt at favorable terms can lock in positive spreads and provide downside protection in rising rate scenarios, while shorter-term floating rate debt offers flexibility if investors anticipate cap rate expansion or the need for early refinancing or disposition.
Conclusion
Cap rate compression in 2026 reflects a commercial real estate market in transition, with pricing supported by strong fundamentals yet constrained by strengthend interest rates and economic uncertainty. Investors who understand the mechanics of compression, the historical cyclical patterns, and the specific dynamics of markets like Southern California can position their portfolios to capture opportunities while managing downside risks.
The current environment demands disciplined analysis, conservative underwriting, and strategic patience. Cap rates alone do not determine investment success—the ability to create value through operational improvements, capitalize on market dislocations, and structure deals that balance risk and return proves decisive. Investors who focus on asset-level fundamentals, maintain adequate liquidity, and partner with experienced operators position themselves to navigate compressed markets successfully.
For accredited investors seeking exposure to carefully selected commercial real estate opportunities in supply-constrained markets, evaluating partnerships with firms that demonstrate proven acquisition discipline and portfolio management expertise becomes essential. Primior’s approach emphasizes fundamental analysis, selective acquisitions, and transparent investor communication throughout market cycles.
Review Primior’s current syndication offerings to explore actively managed investments in Southern California’s commercial real estate markets. Access detailed performance data through the investment calculator to model cap rate scenarios and return projections for your portfolio strategy.