
Most multifamily investors understand the concept of buying underperforming properties, improving them, and selling at a profit. Few, however, can articulate the precise mechanics of how value-add strategies translate into actual returns. The difference between mediocre and exceptional performance lies in executing specific, measurable improvements that drive net operating income growth. This article breaks down the exact strategies that generate returns in value-add multifamily investments, complete with realistic cost structures and expected rent premiums. For accredited investors evaluating opportunities, understanding these fundamentals separates promising deals from overhyped projections.
Understanding the Value-Add Investment Model
The multifamily value-add model operates on a straightforward principle: every dollar of increased net operating income creates approximately $15 to $25 of additional property value, depending on prevailing cap rates in the market. A property purchased at a 5% cap rate that generates an additional $100,000 in annual NOI creates $2 million in equity through forced appreciation. This mathematical relationship makes multifamily assets uniquely attractive compared to other real estate classes where value depends heavily on comparable sales.
Value-add investors target properties trading at 60-80% of market rents, typically due to deferred maintenance, poor management, or outdated unit interiors. The acquisition strategy focuses on identifying the gap between current performance and stabilized potential. A 200-unit property with $900 average rents in a market where comparable renovated units command $1,150 represents a $250 monthly opportunity per unit, or $600,000 in additional annual gross income.
The investment thesis requires precise underwriting of renovation costs, expected rent premiums, renovation timelines, and market absorption rates. Conservative sponsors model 15-20% vacancy during the renovation period and stress-test assumptions against potential market downturns. The hold period typically ranges from 3-7 years, allowing sufficient time to execute the business plan and capture value through refinancing or disposition. Those interested in exploring current offerings can review detailed underwriting assumptions and projected returns for active value-add opportunities.
Unit Interior Renovations: The Primary Return Driver
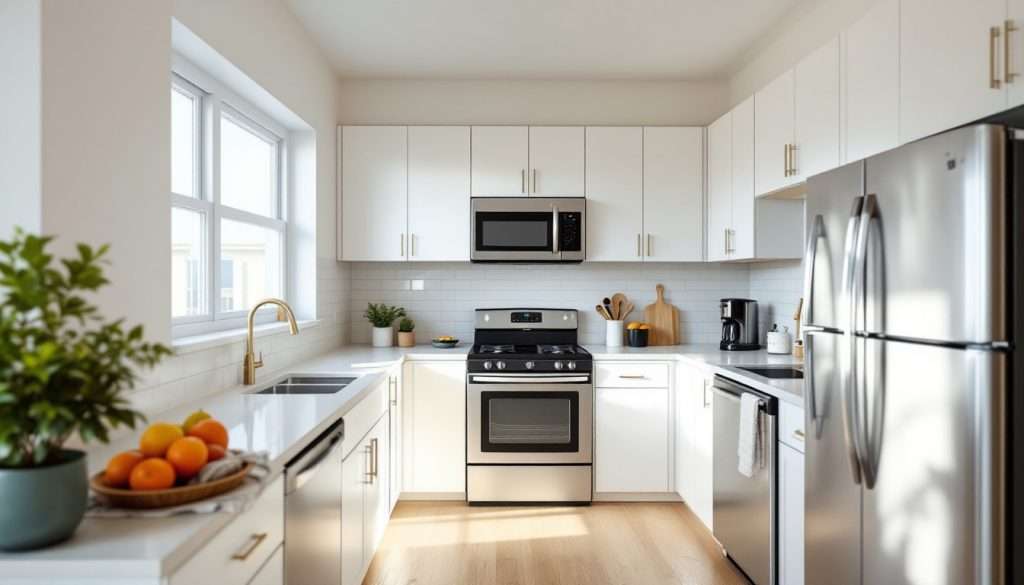
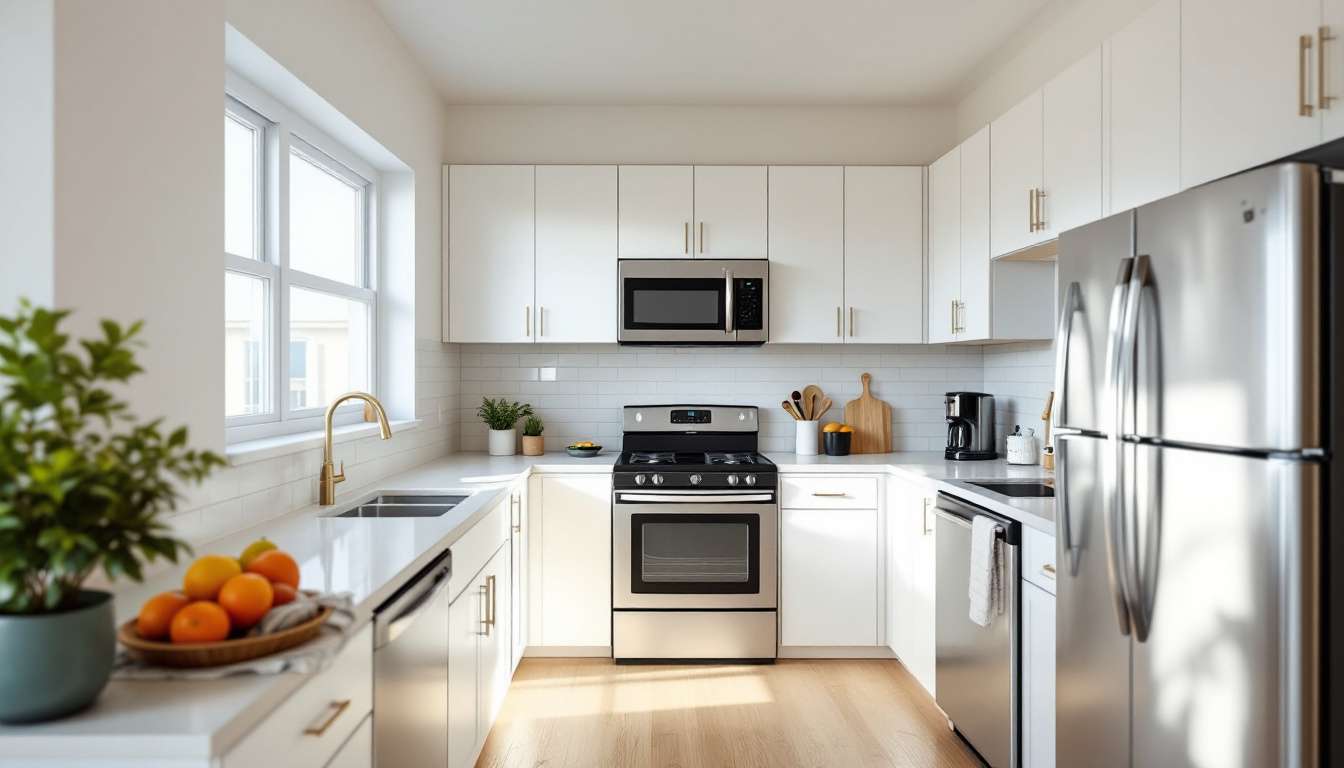
Unit renovations represent the largest capital expenditure and most significant return driver in value-add deals. A well-executed interior renovation typically costs $8,000-$15,000 per unit and generates $150-$300 in monthly rent premiums. The exact figures depend on market demographics, competitive positioning, and scope of work. A Class B property in a strong rental market might spend $12,000 per unit to achieve a $225 monthly premium, creating a simple ROI calculation: $225 monthly premium × 12 months = $2,700 annual rent increase per unit.
Using the cap rate formula, that $2,700 annual rent increase on a property valued at a 5% cap rate creates $54,000 in property value per renovated unit. Subtract the $12,000 renovation cost, and each completed unit generates $42,000 in net equity creation. Multiply across a 200-unit property, and the total forced appreciation from unit renovations alone exceeds $8 million.
Standard renovation scopes include luxury vinyl plank flooring, quartz or granite countertops, stainless steel appliances, updated lighting fixtures, modern cabinet hardware, fresh two-tone paint, and upgraded bathroom fixtures. Some sponsors add washers and dryers in-unit or install smart thermostats and keyless entry systems to command the highest tier rent premiums. The renovation timeline averages 7-10 days per unit with professional crews, allowing a 200-unit property to complete the program in 18-24 months assuming 15-20% of units renovated at any given time.
The critical variable is market rent ceiling. Operators must validate that post-renovation rents fall within the affordability range for target demographics and align with comparable properties. Pushing rents too aggressively results in extended vacancy and lease-up friction. Conservative sponsors phase renovations based on proven rent premiums from initial units rather than underwriting the entire property at pro forma rents immediately.
Amenity Upgrades That Command Premium Rents
Community amenities serve dual purposes in value-add strategies: they justify rent premiums and reduce tenant turnover. A property competing for quality tenants requires contemporary shared spaces that match or exceed nearby alternatives. The most impactful amenity upgrades typically include fitness centers, resort-style pools, co-working spaces, and pet amenities. Each investment must be evaluated against expected rent lift and competitive necessity.
A professional fitness center renovation costs $50,000-$150,000 depending on size and equipment quality. This investment might support a $25-$50 monthly rent premium across the property, particularly for properties targeting young professionals and health-conscious renters. The ROI calculation differs from unit renovations because amenities impact the entire property’s perceived value rather than individual units. A $100,000 fitness center supporting a $35 monthly premium across 200 units generates $84,000 in annual NOI, creating approximately $1.68 million in value at a 5% cap rate.
Pool renovations require larger capital outlays, typically $150,000-$400,000 for resurfacing, new decking, furniture, and landscaping. Markets with warm climates justify these expenditures more readily than northern properties where pools sit unused for extended periods. Co-working spaces emerged as high-value amenities post-2020, requiring $30,000-$80,000 to create professional work-from-home spaces with high-speed internet, private phone booths, and quality furniture.
Dog parks, pet washing stations, and pet-friendly policies increasingly drive leasing velocity and tenant satisfaction. A $20,000-$40,000 investment in quality pet amenities can reduce vacancy days and support pet fees that generate ancillary income. The strategic amenity mix depends on target demographics, but the underlying principle remains consistent: amenities must generate measurable NOI increases that exceed their capital cost when divided by the prevailing cap rate. Examples of completed amenity programs appear in Primior’s portfolio where investors can see our projects and review actual performance data.
Operational Improvements and Expense Reduction
Operational improvements often receive less attention than physical renovations but can generate substantial NOI growth with minimal capital investment. Many value-add properties suffer from inefficient property management, overstaffing, vendor contracts negotiated years prior, and poor expense controls. A systematic operational audit typically identifies 5-15% expense reduction opportunities without compromising service quality.
Property management software implementation represents a foundational improvement. Modern platforms like Yardi or RealPage cost $50-$75 per unit annually but deliver pricing optimization, automated rent collection, maintenance tracking, and financial reporting that transform operational efficiency. Dynamic pricing algorithms adjust rents based on market demand, seasonality, and unit-specific features, often capturing an additional 2-3% in rental income that manual pricing strategies miss.
Maintenance and turnover procedures directly impact both expenses and revenue. Professional value-add operators standardize turnover scopes, maintain preferred vendor relationships with negotiated rates, and implement preventive maintenance schedules that reduce emergency repairs. A property spending $1,200 per turnover can often reduce costs to $800-$900 through process improvements and vendor management. Across a 200-unit property with 50% annual turnover, this $300-$400 per-turn savings generates $30,000-$40,000 in NOI annually.
Insurance, landscaping, pest control, and janitorial services often present renegotiation opportunities. Many underperforming properties operate under legacy contracts that significantly exceed market rates. A comprehensive vendor audit during the first 90 days of ownership can identify immediate expense reductions. Property tax appeals deserve particular attention in markets where properties sell significantly above the prior assessed value, as successful appeals can reduce ongoing tax obligations by 10-20%.
Labor optimization requires careful analysis. Some properties operate with redundant staffing or inefficient shift schedules, while others suffer from understaffing that degrades tenant satisfaction. The goal is appropriate staffing levels with efficient processes, not arbitrary headcount reduction. Properties that improve operational efficiency often see employee satisfaction increase alongside expense ratios that drop from 45-50% to 38-42% of gross revenue.
Utility Submetering and RUBS Implementation
Utility costs represent one of the largest expense categories for multifamily properties, typically consuming 15-25% of operating budgets. Properties where ownership pays all utilities create misaligned incentives: tenants lack motivation to conserve resources, driving consumption above market averages. Utility submetering or Ratio Utility Billing Systems (RUBS) shift costs to tenants, immediately improving NOI while encouraging conservation.
Direct submetering involves installing individual meters for each unit, allowing precise billing based on actual consumption. Installation costs range from $400-$800 per unit for water submetering and $300-$500 for electric submetering where allowed by local regulations. A 200-unit property spending $8,000 monthly on utilities might recover 75-85% of costs through submetering, creating $72,000-$82,000 in annual NOI improvement or approximately $1.44-$1.64 million in property value at a 5% cap rate.
RUBS allocates shared utility costs across units using formulas based on unit size, number of occupants, or other factors permitted by state law. RUBS requires minimal capital investment but delivers less precision than individual metering. Tenants sometimes resist RUBS implementation, making clear communication and proper lease language essential. Most jurisdictions require 30-60 days notice before implementing utility billing changes for existing tenants, though new leases can incorporate billing structures immediately.
The financial impact extends beyond direct cost recovery. Properties with tenant-paid utilities typically command slightly lower rents than comparable properties with utilities included, but the NOI benefit far exceeds any rental concession. A unit renting for $1,100 with utilities included might rent for $1,050 with tenant-paid utilities, a $50 monthly reduction. However, if that unit consumed $125 in monthly utilities, the property nets an additional $75 monthly per unit, or $180,000 annually across 200 units.
State and local regulations govern utility billing practices, requiring compliance with disclosure requirements, billing frequency, and allocation methodologies. Some jurisdictions prohibit profit on utility resale, requiring cost-recovery-only billing. Professional compliance review prevents regulatory issues and ensures billing programs withstand tenant challenges. Investors evaluating value-add opportunities should verify that utility billing changes align with local requirements and represent achievable NOI improvements rather than aggressive assumptions.
Ancillary Income Strategies
Ancillary income encompasses revenue sources beyond base rent, creating meaningful NOI contributions with minimal capital requirements. Parking fees, storage rentals, pet fees, application and administrative charges, and various convenience services collectively add 3-8% to gross revenue at well-operated properties. A 200-unit property generating $2.4 million in annual rental income can realistically add $75,000-$150,000 in ancillary income through systematic implementation.
Reserved parking represents the most accessible ancillary income source. Properties in urban or high-density suburban markets can charge $25-$75 monthly for covered or reserved spaces. A property with 250 parking spaces might designate 80 as reserved parking at $40 monthly, generating $38,400 annually. Covered parking, garages, or EV charging stations command premium rates, with Tesla charging stations sometimes supporting $75-$125 monthly fees. The capital investment for basic reserved parking signage and enforcement is minimal, often under $5,000.
Climate-controlled storage units or exterior storage containers generate reliable recurring income. Adding 30-40 storage units at $50-$75 monthly creates $18,000-$36,000 in annual income. The capital cost varies significantly based on available space and construction requirements, ranging from $15,000 for prefabricated container solutions to $150,000 for climate-controlled interior storage. Properties with excess land or underutilized garage space can achieve particularly attractive ROI on storage additions.
Pet fees follow standard structures: non-refundable pet deposits of $200-$400 per pet, monthly pet rent of $25-$50 per pet, or combination approaches. Pet policies require consistent enforcement and proper insurance coverage, but properties that welcome pets typically enjoy higher occupancy and tenant satisfaction. Approximately 65-70% of renters own pets, making pet-friendly policies a competitive advantage that supports both occupancy and incremental income.
Application fees, lease renewal administrative fees, package locker convenience charges, and short-term furnished units for corporate housing create additional revenue streams. Each income source requires proper lease documentation and compliance with state landlord-tenant laws, which increasingly regulate allowable fees. Conservative underwriting includes only ancillary income sources with demonstrated market acceptance and regulatory compliance. Investors can calculate potential returns including ancillary income assumptions using detailed property-specific inputs.
Management Transition and Professional Operations
Management quality directly impacts property performance, sometimes more than physical improvements. Value-add properties frequently suffer from unprofessional management that accepts high vacancy, poor collections, inadequate marketing, and minimal tenant screening. Transitioning to institutional-quality property management unlocks immediate performance improvements, typically increasing NOI by 8-15% within the first 12 months through better occupancy, collections, and expense controls.
Professional management firms bring systematic processes, technology platforms, regional purchasing power, and experienced personnel. The cost differential between basic management and professional operators typically ranges from 3% to 5% of gross revenue. A property generating $2.4 million in annual revenue might pay an additional $48,000 for professional management, but that investment should generate $192,000-$360,000 in NOI improvement through higher occupancy, better rent collection, and optimized operations.
The transition process requires careful execution. Existing tenants, vendor relationships, and staff require clear communication to prevent disruption. Lease audits identify compliance issues, unauthorized occupants, and expired leases. Rent rolls often contain inaccuracies that mask true economic occupancy. Financial audits establish baseline performance and identify immediate improvement opportunities. The first 90 days determine whether the management transition succeeds or creates operational chaos that damages value.
Marketing transformation represents a critical management function. Outdated websites, poor-quality photos, limited online presence, and inconsistent branding directly impact leasing velocity. Professional photography costs $800-$1,500 but generates returns through reduced vacancy days. Responsive websites, virtual tours, online application processes, and active social media management align properties with how prospective tenants search for housing. Properties that maintain 30-60 day vacancy averages can often reduce to 15-20 days through improved marketing, preventing $50,000-$100,000 in annual rent loss.
Tenant screening standards directly correlate with collections and turnover. Properties that accept marginal applicants to maintain occupancy ultimately suffer from evictions, property damage, and non-payment that destroy value. Professional operators enforce consistent screening criteria: minimum credit scores, income verification at 3x rent, criminal background checks, and prior landlord references. These standards reduce eviction rates from 15-20% to under 5%, dramatically improving operational stability and NOI predictability.
For investors examining the relationship between management quality and property appreciation, comparing buy and hold vs flipping strategies reveals how professional operations compound returns over extended hold periods through both NOI growth and asset preservation.
The NOI-to-Value Formula in Action
The mathematical relationship between NOI improvements and property value creation forms the foundation of value-add investing. Cap rates compress or expand based on market conditions, interest rates, and property quality, but the formula remains constant: Value = NOI ÷ Cap Rate. This allows investors to calculate precise equity creation from each improvement strategy.
Consider a comprehensive example: a 200-unit property purchased for $32 million at a 5.5% cap rate with $1.76 million in NOI. The business plan projects: $12,000 per-unit renovations generating $225 monthly rent premiums, utility submetering recovering $90,000 annually, ancillary income additions contributing $120,000 annually, and operational improvements reducing expenses by $180,000 annually. The unit renovations across 200 units create $540,000 in additional annual rent ($225 × 12 × 200), though assuming 85% economic occupancy during stabilization reduces realized income to $459,000.
The combined NOI improvement totals $849,000 annually: $459,000 from renovations, $90,000 from utilities, $120,000 from ancillary income, and $180,000 from expense reduction. At stabilization, the property generates $2.609 million in NOI. Assuming the property trades at a 5% cap rate at disposition due to improved quality and reduced risk profile, the value reaches $52.18 million. Subtract the $32 million purchase price and $3 million in total capital improvements, and the gross profit reaches $17.18 million over a 4-5 year hold period.
This simplified example demonstrates why value-add multifamily attracts institutional and sophisticated private capital. Few investment strategies offer comparable risk-adjusted returns with forced appreciation driven by operational control rather than market timing. The model works across various property sizes, markets, and vintage years, though specific numbers vary substantially based on location, competition, and execution capability.
Regional market dynamics significantly impact achievable returns. Properties in high-growth markets with strong job growth, limited new supply, and favorable landlord-tenant regulations offer more aggressive value-add potential. Secondary and tertiary markets sometimes present higher percentage returns but with greater execution risk and potential exit challenges. Markets with rent control, strict tenant protections, or significant new supply require conservative underwriting that accounts for regulatory constraints and competitive pressure. Detailed market analysis, including reports like the LA development report, helps investors understand regional dynamics that impact value-add performance.
Conclusion: Execution Determines Returns
Multifamily value-add returns result from disciplined execution of specific, measurable strategies rather than broad market appreciation or speculative timing. The most successful operators excel at underwriting realistic improvement costs, accurately projecting achievable rent premiums, managing renovation timelines without excessive vacancy, and implementing operational improvements that compound over time. Every dollar invested in physical improvements or operational changes must generate NOI increases that justify the capital allocation when measured against prevailing cap rates.
The framework outlined in this playbook provides accredited investors with the analytical tools to evaluate value-add opportunities and understand precisely where projected returns originate. Properties marketed with aggressive pro forma projections deserve scrutiny: do renovation budgets reflect actual contractor bids? Do rent premiums align with comparable properties? Can the market absorb renovated units at projected pace? Does the sponsor have documented experience executing similar business plans? These questions separate realistic business plans from speculative underwriting.
Primior’s approach to multifamily value-add investing emphasizes conservative underwriting, experienced operational partners, and proven strategies that generate consistent returns across market cycles. Rather than chasing the highest projected IRR, focus centers on achievable improvements supported by market data and executable within realistic timelines. For accredited investors seeking to deploy capital into institutional-quality multifamily value-add opportunities with transparent business plans and aligned sponsor incentives, reviewing current investment offerings provides insight into how these principles translate into actual deal structures and return profiles.
The multifamily value-add model will continue evolving as markets shift, tenant preferences change, and operational technologies advance. The fundamental principle endures: properties that deliver quality housing at appropriate price points through professional operations generate sustainable cash flow and appreciation. Investors who understand the mechanics of value creation, demand rigorous underwriting, and partner with experienced operators position themselves to capture meaningful returns while managing downside risk through diversification and conservative assumptions.