Orange County commercial real estate markets are operating in a recovery cycle characterized by stabilizing cap rates, renewed transactional activity, and selective investor demand focused on defensive asset classes. After two years of valuation compression and elevated interest rates, institutional capital is returning to Orange County properties that demonstrate stable cash flows and long-term tenant commitments.
This report examines Orange County commercial real estate market conditions in 2026, including cap rate trends, demand drivers by asset class, investment volumes, and strategic positioning for sponsors and investors evaluating Orange County opportunities.
Market Overview: Investment Volume and Transaction Activity
Commercial real estate investment activity across the United States is projected to increase by 16 percent to $562 billion in 2026, approaching pre-pandemic transaction levels. Orange County is participating in this recovery, driven by institutional demand for industrial, medical office, and grocery-anchored retail properties.
However, office and speculative multifamily development remain under pressure. Investors are applying strict underwriting discipline, prioritizing cash flow over appreciation and avoiding assets with uncertain tenant demand or elevated vacancy risk.
Cap Rate Trends: Stabilization After Compression
Cap rates across Orange County commercial properties have stabilized after significant compression during the 2021-2022 period. Current cap rates reflect the elevated interest rate environment and investor expectations for income-driven returns rather than rapid appreciation.
Industrial and Logistics
Industrial properties in Orange County continue to attract institutional capital due to e-commerce demand, proximity to the Ports of Long Beach and Los Angeles, and limited developable land supply. Cap rates for Class A industrial assets in prime Orange County submarkets are trading between 4.5 percent and 5.5 percent.
Older industrial buildings in secondary locations or those requiring capital improvements are trading at cap rates between 5.5 percent and 6.5 percent, reflecting the cost of repositioning and lower tenant credit quality.
Medical Office
Orange County’s medical office sector remains one of the most defensive asset classes in the market. Properties with long-term leases to healthcare systems, surgical centers, or dialysis operators are trading at cap rates between 5.0 percent and 6.0 percent.
Medical office buildings with short-term leases, higher tenant turnover, or proximity to aging hospital campuses face cap rates between 6.0 percent and 7.0 percent.
Retail: Grocery-Anchored vs Lifestyle Centers
Grocery-anchored retail centers with credit tenants (Whole Foods, Trader Joe’s, Pavilions) are trading at cap rates between 5.5 percent and 6.5 percent. These properties offer recession-resistant cash flows and long-term lease structures.
Lifestyle centers and entertainment-focused retail properties face more uncertainty. Cap rates for these assets range between 6.5 percent and 8.0 percent, reflecting higher tenant turnover risk and sensitivity to consumer discretionary spending.
Office: A Bifurcated Market
Orange County office properties demonstrate severe bifurcation based on vintage and location. Class A office buildings constructed after 2015 in prime submarkets like Irvine Spectrum or Newport Center are trading at cap rates between 6.0 percent and 7.0 percent.
Legacy office buildings constructed before 2010, particularly those in aging suburban corridors with limited amenities, are experiencing cap rates between 8.0 percent and 10.0 percent or higher. Many of these assets face structural vacancy challenges tied to remote work adoption and tenant flight to quality.
Multifamily: Supply Pressure in Certain Submarkets
Multifamily cap rates in Orange County vary significantly by submarket and vintage. Class A properties in high-demand areas like Irvine, Costa Mesa, and Newport Beach are trading at cap rates between 4.5 percent and 5.5 percent.
Properties in submarkets experiencing elevated new supply deliveries or facing competition from single-family rentals are trading at cap rates between 5.5 percent and 6.5 percent.
Demand Drivers by Asset Class
Orange County’s commercial real estate demand is driven by distinct factors across property types.
Industrial: Port Proximity and E-Commerce
Orange County’s industrial market benefits from direct access to Southern California’s port complex, which handles the highest volume of containerized imports in the United States. Last-mile distribution facilities and cold storage properties continue to see strong tenant demand.
However, new supply in the Inland Empire (Riverside and San Bernardino counties) has created competitive pressure for Orange County industrial properties that do not offer superior location advantages or specialized features.
Medical Office: Healthcare System Expansion
Orange County’s aging population and high concentration of healthcare systems (Hoag, UCI Health, MemorialCare) drive sustained demand for medical office space. Healthcare operators are seeking properties with proximity to hospital campuses, surgical centers, and outpatient facilities.
New medical office construction remains limited due to land scarcity and entitlement complexity, creating tight supply conditions that support stable occupancy and rent growth.
Retail: Experiential and Necessity-Based Tenants
Retail demand in Orange County is bifurcating between experiential tenants (restaurants, fitness, entertainment) and necessity-based tenants (grocery, pharmacy, urgent care). Landlords who can assemble tenant mixes combining both categories are achieving the highest rents and lowest vacancy.
Traditional soft goods retail (apparel, electronics) continues to face structural headwinds from e-commerce competition.
Office: Flight to Quality
Orange County office tenants are prioritizing Class A buildings with modern amenities, parking, and accessibility. Legacy office buildings without recent capital improvements are struggling to retain tenants or attract new leases at competitive rates.
Landlords considering office investments must evaluate repositioning costs, competitive positioning, and realistic lease-up timelines before committing capital.
Multifamily: Rent Growth Moderation
Multifamily rent growth in Orange County moderated to low single digits in 2025, reflecting elevated supply deliveries in certain submarkets. National multifamily asking rent growth slowed to 1.1 percent in late 2025, and Orange County mirrors this trend in markets with new supply.
However, submarkets with limited new construction pipelines and strong employment fundamentals (Irvine, Newport Beach) continue to demonstrate stronger rent performance.
Investment Outlook: Selectivity and Defensive Positioning
Institutional investors evaluating Orange County commercial real estate in 2026 are prioritizing:
1. Cash Flow Stability: Properties with long-term leases, credit tenants, and defensive demand characteristics are receiving premium pricing.
2. Asset Quality: Class A properties with recent capital improvements and modern amenities are attracting institutional bids. Legacy assets require significant discounts to justify repositioning costs.
3. Location: Submarkets with employment growth, transportation access, and walkable amenities are outperforming suburban locations dependent on automotive access.
4. Exit Clarity: Sponsors must demonstrate realistic paths to refinancing or sale. Properties with uncertain exit assumptions face higher cost of capital or outright rejection from lenders and equity partners.
Strategic Positioning for Sponsors
Sponsors raising capital for Orange County deals should focus on:
1. Conservative Underwriting: Use realistic rent growth assumptions (1 to 3 percent annually) and stress-test cash flow models for interest rate volatility.
2. Asset-Class Selection: Prioritize defensive asset classes (industrial, medical office, grocery-anchored retail) over speculative plays in office or oversupplied multifamily submarkets.
3. Value-Add with Discipline: If pursuing value-add strategies, demonstrate clear paths to rent growth, occupancy improvement, and operational efficiency. Avoid aggressive bridge debt structures without refinancing contingencies.
4. Ground-Up with Caution: New development requires detailed entitlement analysis, construction cost sensitivity, and realistic absorption timelines. Smaller, boutique developments may offer faster paths to stabilization than large podium structures.
Key Orange County Submarkets: Investment Characteristics
Understanding submarket dynamics within Orange County is critical for sponsors and investors evaluating opportunities.
Irvine: Institutional Grade Assets
Irvine remains Orange County’s most institutional-grade submarket, characterized by master-planned communities, corporate office campuses, and high-quality multifamily and retail properties. Cap rates in Irvine reflect premium pricing due to tenant credit quality, employment concentration, and limited land supply.
Industrial properties in Irvine trade at cap rates below 5.0 percent due to scarcity and location advantages. Multifamily assets in Irvine command some of the highest rents in Orange County, supported by strong employment fundamentals and high household incomes.
Newport Beach and Costa Mesa: Luxury Residential and Office
Newport Beach and Costa Mesa attract high-income residents and premium office tenants. Medical office properties in these submarkets benefit from proximity to Hoag Hospital and outpatient surgical centers. Retail properties along Pacific Coast Highway and in Fashion Island command premium rents due to affluent customer demographics.
Cap rates for Class A properties in Newport Beach and Costa Mesa range between 4.5 percent and 5.5 percent for multifamily and retail, and 5.5 percent to 6.5 percent for medical office.
Anaheim and Santa Ana: Value-Add Opportunities
Anaheim and Santa Ana offer value-add opportunities for sponsors targeting workforce housing and industrial repositioning. These submarkets have lower acquisition costs relative to coastal Orange County but face higher tenant turnover and operational complexity.
Cap rates for value-add opportunities in Anaheim and Santa Ana range between 6.0 percent and 7.5 percent, depending on asset condition, tenant quality, and required capital expenditures.
South Orange County: Single-Family Rental Competition
South Orange County submarkets (Mission Viejo, Laguna Niguel, San Clemente) face competitive pressure from single-family rental operators. Multifamily properties in these markets must differentiate through amenities, unit size, and proximity to employment centers to compete effectively.
Orange County vs Inland Empire: Competitive Dynamics
Orange County industrial and multifamily sponsors face direct competition from the Inland Empire, where land costs and construction expenses are significantly lower. However, Orange County offers superior location advantages for tenants prioritizing coastal proximity, higher-income demographics, and access to skilled labor.
Sponsors must clearly articulate these location premiums in investor presentations and demonstrate that rent premiums justify higher acquisition and development costs. For investors evaluating regional positioning, understanding [LA and Orange County development trends]la-oc-dev-report/) provides critical context on competitive dynamics.
Conclusion
Orange County commercial real estate markets in 2026 are characterized by stabilizing cap rates, selective institutional demand, and bifurcation by asset quality and location. Investors prioritizing defensive cash flows, Class A assets, and submarkets with employment growth will find opportunities.
Sponsors must apply conservative underwriting, realistic rent assumptions, and clear exit strategies to secure capital. Office and speculative multifamily investments require significant due diligence and discounts to justify risk. Industrial, medical office, and grocery-anchored retail remain the most attractive asset classes for institutional capital in Orange County.
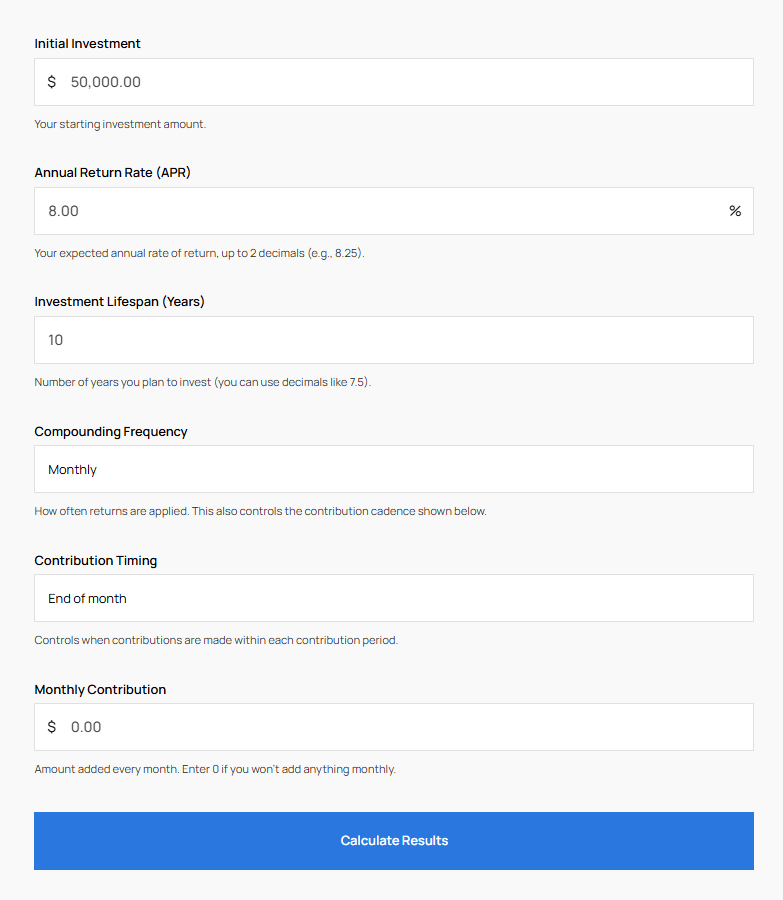
For detailed market analysis and investment opportunities in Orange County, explore Primior’s commercial real estate reportscre-report/) and current syndication offerings). Use Primior’s investment calculator) to model returns across different asset classes and holding periods.